Drawn from MHS collections, our primary source sets promote learning in U.S. history and civics and are supported by teaching activities and guiding questions.


Mapping Colonial Boston

What biases or perspectives are depicted in the following maps of early Boston? How did the city’s geography impact the American Revolutionary War?

    Source Set

    Download Source Set

    Glossary

    Wharf (wharves, pl.):
    a long platform constructed in a harbor that allows ships to dock and unload their goods.

    Ropewalk:
    a long, narrow area where workers would lie long fibers which would be twisted to make rope. Twisting the fibers increased the rope’s strength.

    Smallpox:
    smallpox was a deadly, contagious disease that sickened or killed many people in colonial America. In the early 1800s, scientists developed the first vaccine to protect people from smallpox.

    Reading Maps

    Maps tell stories. As you read the Bonner map of 1722 consider:

    What is included? What is left out?

    Bonner’s choices give us information about:

    • The information available to him
    • The purpose of the map

    What is the perspective (point of view) of the map? 

    From what direction are we shown items on the map?

    What knowledge did Bonner have about his world?

    What can you learn about 1720s British North America from this map?


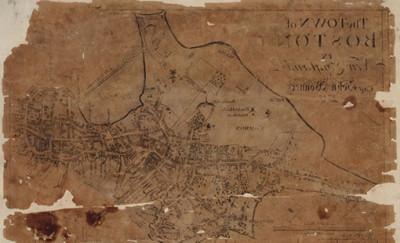
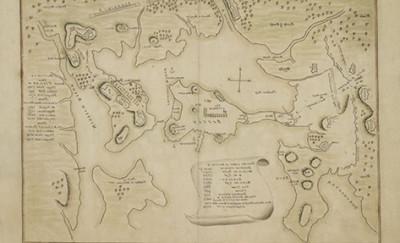
    The Town of Boston in New England by John Bonner is the first printed map of Boston, Massachusetts. Bonner (circa 1643-1726) was a captain, navigator, and shipwright. A wealth of information about pre-Revolutionary Boston is available through Bonner's map, including street layouts, churches, and public buildings.

    The map also illustrates Boston's importance as a port city, detailing the location of docks, shipyards, wharves, and ropewalks. Bonner's map includes the years of construction for significant churches and public buildings, as well as the years in which great fires and outbreaks of smallpox occurred. At the time of printing, Boston had 42 streets, 36 lanes, and 22 alleys. There were nearly 3,000 houses of which 1,000 were brick and the rest were of timber. The population was estimated to be near 15,000. 

    Citation: The Town of Boston in New England by Capt. John Bonner, Map, Boston: printed by Francis Dewing, 1722 [i.e. 1725], Massachusetts Historical Society, http://mdj.imtiazqazi.com/database/1732.
    More

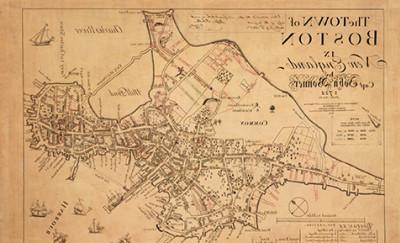
    In 1835, George Girdler Smith (1795-1878), an engraver, re-issued the 1722 Bonner map of Boston. The facsimile map includes alterations to the topography of Boston since the first printing of Bonner's map in 1722. These alterations—new streets, buildings, and waterfront developments—appear in red, blue, and green ink.

    Alterations in red occurred between 1722 and 1733; in blue, between 1734 and 1743; and in green, between 1743 and 1769. The map does not reflect changes made to the Mill Pond area near the North End which the city filled in 1804 with earth taken from Beacon Hill. The map includes an index to points of interest and chronological lists of "Great Fires" and "Genll. small pox."

    Citation: The Town of Boston in New England by Capt. John Bonner, 1722, Facsimile map by George Smith after map by John Bonner, Boston: George G. Smith, 1835, This is a facsimile of the map engraved and printed by Francis Dewing, Boston, 1722 [i.e.1725] Massachusetts Historical Society, http://mdj.imtiazqazi.com/database/1733.
    More

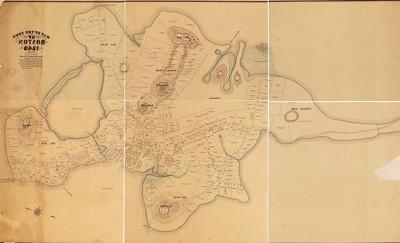
    Completed on 10 April 1919, this map by Samuel Chester Clough (1873-1949) shows property owners and land lots in Boston, Massachusetts, in 1648. This map informs his later maps of 1676 and 1798, as well as his atlas.

    An inscription on this map lists Clough's sources: "Drawn by Samuel C. Clough in accordance with information compiled from the records of the Colony, Town, Registry of Deeds, Suffolk Probate, and Supreme Court; Book of Possessions, Winthrop Journal, Lechford Note Book, Aspinwall's Notes and City Surveys." The map shows a densely populated Shawmut peninsula, especially the area around present-day State Street, Government Center, and Faneuil Hall. The hills, fields, and marshland all but disappear over the next century as the land was divided, sold, made, and developed. The map hints that the North End was practically an island, with a tidal creek connecting the Mill Cove to the Great Cove.

    Citation: Map of the Town of Boston 1648; Drawn by Samuel C. Clough, in Accordance with Information Compiled from the Records of the Colony, Manuscript map by Samuel Chester Clough, 10 April 1919, From the Samuel Chester Clough research materials toward a topographical history of Boston, Massachusetts Historical Society, http://mdj.imtiazqazi.com/database/1736.
    More

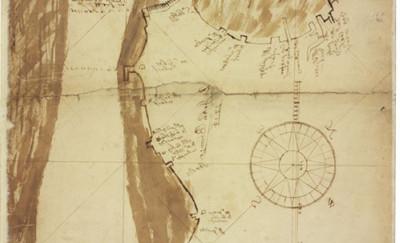
    Captain John Bonner's map shows the wharves along the Boston waterfront from Long Wharf to the South Battery to "Winmel Poynt" (Windmill Point). Bonner's map also includes notations about water depth.

    Citation: Manuscript map of Long Wharf (Boston, Mass.), 1714, Pen and ink by John Bonner, Massachusetts Historical Society, http://mdj.imtiazqazi.com/database/1725.
    More

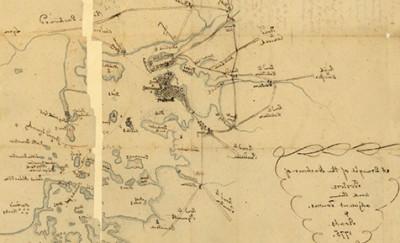
    This map of Boston and Charlestown was made in November 1775 by a British officer (possibly S. Biggs) and shows major geographic landmarks and man-made fortifications in the Boston area.

    Many of the entrenchments, redoubts, and fortified structures are labeled with reference numbers: "1) Charlestown & entrenchments on the heights. 2) The Rebels Redoubt & Entrencht [of] 17th June sine demolished. 3) The difft Lines & Works of the Rebels. 4. Our works." Also included on the map are two lists showing distances in yards between Boston and various points, as well as from Mount Pisgah, near Winter Hill in Somerville, to various points.

    Citation: Manuscript map of the Battle of Bunker Hill, 1775, Pen and ink and watercolor attributed to S. Biggs, 28 November 1775, Massachusetts Historical Society, http://mdj.imtiazqazi.com/database/1712.
    More

    This manuscript map of Boston Harbor created by Jeremy Belknap in 1775, presents a large perspective of Eastern Massachusetts and the islands in the Massachusetts Bay. This map depicts the harbor islands, coastal towns from Lynn to Hingham, and roads to inland towns such as Providence, Taunton, Watertown, Worcester, Concord, and Andover.

    Belknap's map indicates the major settlements and developments in Boston, Roxbury, and Charlestown, as well as minor settlements and developments in Medford, Malden, Cambridge, Watertown, and at Point Shirley in Winthrop. A piece of the map is missing along the fold line.

    Citation: Manuscript map of the Boston Harbor, 1775, Pen and ink by Jeremy Belknap, Massachusetts Historical Society, http://mdj.imtiazqazi.com/database/1713.
    More

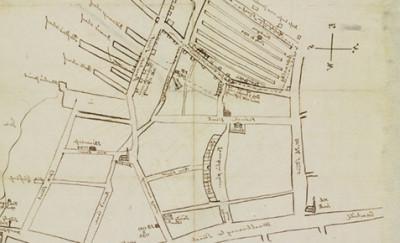
    This manuscript map by Jeremy Belknap was enclosed in a letter he sent to Ebenezer Hazard on 20 September 1794 and shows the Tontine Crescent, churches and meetinghouses (including the Old South Meeting House, Trinity Church, and the Federal Street Church), wharves, and the locations of Belknap's various residences in Boston.

    The map also shows the location of the origin of a fire on 30 July 1794 (within the ropewalks located near Fort Hill) and a dotted line indicates the extent of the damage. The map's western boundary is present-day Washington Street.

    Citation: Manuscript map of Boston (Mass.), 20 September 1794, drawn by Jeremy Belknap, Enclosed in a letter from Jeremy Belknap to Ebenezer Hazard, 20 September 1794, From the Jeremy Belknap papers, Massachusetts Historical Society, http://mdj.imtiazqazi.com/database/1729.
    More

    This map by Benjamin Dearborn (1754-1838) is a proposal to construct what he called "Perpetual Tide Mills" across the Back Bay and South Bay in Boston. The plan details water and marshland as well as streets and roads of Boston, Roxbury, Brookline, Charlestown, Cambridge, Brighton, and Dorchester.

    Dearborn's map, which introduces an extensive series of canals, dams, and toll roads, is a variation on a previously proposed Mill Dam project. Creating a Mill Dam and road across the Back Bay came on the heels of the successful Mill Pond project near Boston's North End.

    The aim of the Mill Dam was to use the tides of the Charles River to power mills for industrial purposes. Additionally, the Dam would serve as a toll road. In the end, Dearborn's plan was not realized and a much simpler Mill Dam was built by 1821. Eventually, this project failed in part because of sewage and wastewater build-up in the tidal basins. This build-up caused unpleasant smells that drifted all over the city. As a result, in May 1855, the Back Bay began to be filled in and developed.

    Citation: A Plan of those Parts of Boston and the Towns in its Vicinity: with the Waters and Flats Adjacent ... Boston: Benjamin Dearborn, [1814], Massachusetts Historical Society, http://mdj.imtiazqazi.com/database/1735.
    More
    For Teachers
    Source Type
    Grade Span

    This source set was created by MHS staff and Debra Block, Matters of Education

    Mapping Colonial Boston

    With a particular focus on the 1722 map of Boston by John Bonner and the updated edition by George Smith in 1835, this document set includes several maps that depict Boston during the colonial period as well as a few later maps that provide an opportunity for comparison. By examining these documents, students will be able to consider how maps are not objective, but instead construct a particular narrative about the place that they depict. Students will learn how sites important to the American Revolution, including Boston Harbor, Boston Common, and the Liberty Tree, relate to one another.

    Suggested Activities

    See-Think-Wonder

    Students look at visual document and respond to the following questions, allowing time to process before they participate:

    What do you See? What do you Think is going On?

    Students should reflect/process the material individually before sharing in small groups/with the class. This is an essential activity to enable students to support claims with evidence and to guarantee that facts generate opinions, rather than the reverse.

    • Justify your answers—why do you think/say that? Show me in the text.
    • What does it make you Wonder?
    Teaching with Maps

    We expect maps to be objective documents but like every other primary source, they reflect the bias of their creator and should be considered within the context of the time in which they were created.  As you look at the Bonner map of Boston, 1772, think about the following:

    What is included and what is omitted?  The choices the mapmaker made reflect:

    • What the mapmaker knew, i.e. what information was available 
    • The reason or purpose that the map was made
    What is the perspective or point of view of the map—literally from what direction are we shown the items on the map? A map reflects a state of knowledge--what did the mapmaker know about their world? What clues do you have about what was going on in the world when this map was made? Maps tell stories. What is the story that this map tells?
    Contemporary Perspectives

    Ask students to examine the Bonner map edited by George Smith in 1836; the Briggs map of the Battle of Bunker Hill from 1775; and/or the Belknap map of Boston Harbor from 1775, and compare them to the Bonner map of 1722.

    Do they confirm or refute the story told in the Bonner map? Do they complicate the narrative presented?  Why do people have different understandings of the same event?  What might be the source of these different impressions?

    Historical Perspectives

    Ask students to examine the following documents and compare them to the Bonner map of 1722:

    Do the maps confirm or refute the story told in the Bonner map? Do the maps complicate the narrative presented? Why do people have different understandings of the same event as time passes?  What might be the source of these different impressions? Look at earlier maps of the Shawmut Peninsula. Compare with this 1814 Map of Boston. What has changed and what has stayed the same? How can you explain the changes in the names of the streets? Find five things that are still in Boston on the Bonner map. Why do you think they have endured?

    Focus on the American Revolution

    The Bonner map of 1722 and the revised edition from 1835 provide significant information about key events of the American Revolution. Some questions to begin student inquiry:

    What is the date of this map? The harbor was key to the city. How does its presence dominate the map? What are the various uses of the Common? How do they show what was important to the people of Boston? Which areas of the city were the most densely populated? Why do you think they were so crowded?

    Stamp Act Protests

    The Seven Years War was fought between the British and the French in North America from 1756 to 1763. The conflict cost the British and the colonists dearly, both in terms of resources and human life. To cover the financial costs of war, the British placed many new taxes on the colonies. One that was particularly troubling was the Stamp Act of 1765 which increased the cost of almost every item that the colonists had to purchase. Anger was directed towards representatives of the King’s government. On the evening of August 14th, 1765 a crowd gathered to protest this law. Using the Bonner map, trace their steps. Imagine how it felt to be part of the crowd:

    On the morning of 14 August, residents of Boston saw effigies of the local stamp officer, Andrew Oliver and King’s former tutor, Lord Bute, hanging from the Liberty Tree (crossing of Essex and Newbury Streets). Farmers bringing produce in from the interior on the Boston ‘Neck’ (Orange/Marlborough St) had ‘mock’ stamps placed on their cargo. Crowds gathered at the Liberty Tree. The effigies were cut down and then a mock funeral processed through the city, passing the Town House. Then the crowd destroyed the Stamp Office on Kilby Street at Oliver’s Dock. Afterwards, the crowd set a bonfire at Fort Hill. British officials stored the remaining stamps on Castle William.

    Applicable Standards

    C3 Framework for Social Studies Standards
    • D2.Geo.2.3-5. Use maps, satellite images, photographs, and other representations to explain relationships between the locations of places and regions and their environmental characteristics. 
    • D2.Geo.4.9-12. Analyze relationships and interactions within and between human and physical systems to explain reciprocal influences that occur among them.
    • D2.His.1.6-8. Analyze connections among events and developments in broader historical contexts.
    • D2.His.5.9-12. Analyze how historical contexts shaped and continue to shape people’s perspectives.
    • D2.His.13.6-8. Evaluate the relevancy and utility of a historical source based on information such as maker, date, place of origin, intended audience, and purpose.
    MA 2018 HSS Standards
    • Grade 3, Topic 1, Massachusetts cities and towns today and in history 
    • Grade 3, Topic 6, Massachusetts in the 18th century through the American Revolution 
    • Grade 5, Topic 2, Reasons for revolution, the Revolutionary War, and the formation of government 
    • Grade 6, Topic 1, Studying Complex Societies, past and present 
    • Grade 8, Topic 1, The philosophical foundations of the United States political system 
    • US History 1, Topic 1, Origins of the Revolution and the Constitution US Government and Politics Elective, 
    • US History 1, Topic 1, Foundations of government in the United States


    Funding from the Massachusetts Society of the Cincinnati supported this project.

    Additional Resources

    Questions or suggestions? Contact us at education@imtiazqazi.com.